Showing posts with label Presentation Services. Show all posts

Wednesday, August 29, 2012

[nQSError: 43023] Number of sessions exceeded the limit.


Oracle Business Intelligence - When a user tries to login, he will get an error called- [nQSError: 43023] Number of sessions exceeded the limit, because the maximum number of users are already logged in. to know more about this error please visit this link - http://obieeblog-jagga.blogspot.in/2012/08/nqserror-43023-number-of-sessions.html.


NQSConfig.ini is a configuration file, where we can configure the OBI Server however we want. MAX_SESSION_LIMIT is a parameter in NQSConfig.ini file to configure the maximum number of session that can be opened at a time. For example, if you set a value 10 to this parameter(MAX_SESSION_LIMIT = 10), then only 10 users can be login. Assume that, 10 users are already logged in, now if any user tries to login then he will get the following error, because the session limit is reached already. The users has to wait until any one of the user(who have logged in) logged out from the session.


To resolve this problem you just follow the below instructions.
Open the NQSConfig.INI file and locate the [ SERVER ] section,  check the number for MAX_SESSION_LIMIT = 1000 ; parameter. (by default this parameter value will be 1000)

If the value for this parameter is less than the number of concurrent users of your application, then increase the number as it should be equal or greater than the number  concurrent users of your application.

If I am wrong, feel free to suggest me please.

Wednesday, July 4, 2012

Direct Database Request in OBIEE

This property allows users to execute physical queries directly from Presentation Services.

The users can execute the following Statements in Direct Database Request from Presentation Services directly : 
SELECT
INSERT
DELETE
DROP
UPDATE
PROCEDURE - users can create procedures from Presentation Services.
TRIGGER etc.
How to use this Property ?
[The below steps are written with the assumption of all the privileges are set to the user. If you stuck in any of the following steps, see the Necessary Privileges section in the same post.]

Step 1 : In Answers, Click on Create Direct Request under Direct Database Request.
Step 2 : In Connection Pool Section, write the correct connection pool name.
            [You can get the connection pool name from Administration Tool. Read More].
            In SQL Statement Section, write the SQL.
            Then click on Validate SQL and Retrieve Columns button.          
            There you can see the column list in Result Section.

Then click on Results Tab to see the Results.
Necessary Privileges :
Necessary Privileges, a user should have to use the direct Database Request are as follows :
  • Edit Direct Database Requests
  • Execute Direct Database Requests
Edit Direct Database Requests
If the user does not have Direct Database Request  privileges, then the Direct Database Request section will not be showed in Answers for such user.
To set the Direct Database Request privilege to any user follow the below steps :
Step 1 : Go to Settings > Administration

Step 2 : In Oracle BI Presentation Services Administration window, then locate Manage Privileges  and click           on it.

Step 3 : In the Privilege Administration window, go to Answers section, locate Edit Direct Database Requests, then click on the link.

Step 4 : In Change Privilege Permissions window,  Choose the user to which you want to grant permission, then click on Add.

Step 5 : Now Log in as a user to which you just granted permission and check that Direct Database Request section will be appear for that user in Answers.
Execute Direct Database Requests
In the Privilege Administration window (to open Privilege Administration window,just refer the above steps), go to Answers section, locate Execute Direct Database Requests and grant the this privilege to the desired user.


And one more thing you should do is, go to Administration Tool, grant the Execute Direct Database Requests permission to that user.
To grant Execute Direct Database Requests permission in Administration Tool, follow the below steps.
1. Open Administration Tool, Go to Manage > Security
2. Select the user/ group from left pane of Security Manager window.
3. Double click on the user/ group name.
4. Click on Permission,.
5. In User/Group Permissions window, go to Execute Direct Database Request and select Allow.
6. Click OK.

Note :  If configured incorrectly, it can expose sensitive data to an unintended audience.

Friday, June 22, 2012

Presentation Server Cache in OBIEE

Presentation Server  has its own cache, stores the result set of queries in that cache. When the user requests any query, and if the query is similar to the one which is stored in cache memory, then the Presentation Server will retrieve the result for this query  from the cache and return the result to the user without contacting the BI Server. This improves the query response time, eliminates BI server processing time.

The files for the Presentation Services cache:
  • Have names such as nQS_xxxx_x_xxxxxx.TMP.
  • Are stored in the following directory:
         C:\OracleBIData\tmp
Refer the following link to know more about the presentation cache : 

Thursday, June 21, 2012

Restrict the Number of Rows Per Page in Table View

By default, 25 rows will be displayed per page in a table view.

If you want to display more or less than 25 rows per page, you need to edit the table view properties.
Follow the below steps :
1. Click on Edit view of table view.

2. Click on Table Properties, then enter the value for Rows Per Page option in Edit view window.
3. Click on OK and check the result.

To see all the rows, click on "arrow star button", then all the rows will be displayed at a time.

Restict Number of Row for Table View in OBIEE

OBIEE Presentation server provides an ability to restrict the number of rows to be displayed in table view.

The Administrator can set the number of rows to be displayed in table view by configuring the InstanceConfig.xml file.  

Assume that, a table called Emp_Olem consists of 1000 rows, by default all the rows will be display in table view. Administrator can restrict to 10 (or any number he can specify ) rows. 
Below are the steps to achieve this :
1. Open instanceconfig.xml file.
2. Locate <ResultRowLimit >  tag and define the number of rows to be displayed.
         <ResultRowLimit >10</ResultRowLimit >
     If the above tag is not there in your config file, then add it.
        <ServerInstance>
             <ResultRowLimit >10</ResultRowLimit >
        <ServerInstance>
     
 3. Save the file and restart the Presentation Server.
 4. Now, check the result.
Drag some logical columns into Answers then click on Results.
Only ten rows are displaying even though the table having 1000 rows. But in Pivote Table, all the rows will be display. This applies only to table view.

Note : BI server retries all the rows, ie 1000 rows from the database but display only ten 10 rows in table view.

We can also configure number of rows to be display per page. To read about this click here.

Monday, June 11, 2012

Bypass Oracle BI Presentation Services Cache

We can By pass the presentation cach, by selecting the check box option for Bypass Oracle BI Presentation Services Cache in Advanced tab of any Answers.

Friday, June 8, 2012

Manipulating Session Variables from Answers

As my knowledge, session variables can be manipulated in Answers or dashboard of Presentation services in two possible ways.
  • Request Variable
  • NQSSetSessionValue 

 Request Variable

A request variable is a variable that is used to temporarily override the value of a session variable. The request variables are defined in the Presentation Services using either :

  • Dashboard prompts or
  • SET VARIABLE statement.
A variable whose name should not match that of a repository variable or a security system session variable(USER, GROUP etc..).

Using request variables we can change the value of session variables for any request or for all requests in any dashboard. But we can not change the value permanently through out the session. If we want to change the value of session variable for the entire session, then we can use the ODBC function NQSSetSessionValue. To know how to use request variable in presentation services, Click Here >>.

NQSSetSessionValue 

NQSSetSessionValue is an ODBC function, can be used to change the value of session variable for the whole session.

The syntax for this function is : 
                                               call NQSSetSessionValue('DataType VariableName=Value;')

We can call this function from from Issue SQL Directly section of Presentaion Services. To know how to use request variable in presentation services, Cick Here >>.

Wednesday, May 30, 2012

Logical SQL in OBIEE


Logical SQL is the SQL that can understand by OBI Server.When a user requests data, then the presentation services server prepares a Logica SQL and send it to OBI Server to retrieve dataset.The Oracle BI Server transforms the Logical SQL into physical SQL through a process known as query processing that can be understood by source databases.


In Presentation Service, when you create an answer or a dashboard prompt, you create in fact a logical SQL that you can see in the Advanced Tab of the answer


Tuesday, March 6, 2012

Change Port Number For OBIEE Presentation Services

On a default installation OBIEE runs on web port 9704.
Eg : http://nws1018:9704/analytics/saw.dll?Answers


If you want to run the webservice on different portnumber or even better from the default port 80, then follow with the below steps.

Step 1 : Navigate to your OC4J config directory.
                 ..:\OracleBI\oc4j_bi\j2ee\home\config 

Step 2 :Open the file named default-web-site.xml
Note : Before doing any changes to this file, better take a backup of this file.

Step 3 : Locate port in <web-site> tag and change it to 80(port="80").


Step 4: Save and close the file.

Step : Stop and Start the your OC4J.

Now you can run Presentation Services on port number 80.
Eg : http://nws1018:80/analytics/saw.dll?Answers 

Tuesday, February 7, 2012

Image Promt In OBIEE

In my case, I am using India map, when a user clicks on any state it will show population for that state by district wise.

I have used the following image named india_map.jpg


1. Create a folder "images" in the following location and copy the above image in "images"    folder.
D:\OracleBI\oc4j_bi\j2ee\home\applications\analytics\analytics

2. Then Restart the OC4J.

3. Check whether you are able to access the image using the following URL.
http://localhost:9704/analytics/images/india_map.jpg 

In browser, if u get the image, then no issues with the image path. When you are not able to see the image, then there might be problem with the image path. Correct it and try again.


4. Consider the following criteria using the MAP table(in my example):


5. To add Image prompt, go to Prompts -> create prompt. Then select Image Prompt.


6. Fill the details as below.


Code  which I have used for image map is  : 
<map id="india" name="india">
<area shape="poly" alt="Karnataka" coords="150,283,148,292,146,296,147,305,143,314,140,321,140,324,135,335,140,343,145,343,145,345,140,347,141,350,141,351,152,350,159,354,160,360,150,365,149,374,145,380,140,380,138,382,130,386,105,365,107,341,104,329,102,324,99,323,103,314,100,309,105,305,110,301,118,303,121,297,131,295,143,282" href="http://www.indiaonlinepages.com/population/karnataka-population.html" title="Karnataka" target="_blank" />
<area shape="poly" alt="Chennai" coords="143,380,144,386,148,393,153,401,154,406,159,412,162,417,167,422,169,413,173,408,178,408,182,404,180,397,179,386,188,366,187,353,176,361,170,363,167,361,165,365,162,367,151,368" href="http://www.census.tn.nic.in/" title="Chennai" target="_blank" />
<area shape="poly" alt="Goa" coords="91,320,100,323,102,328,100,330,99,332,96,332,93,330" href="http://www.citypopulation.de/India-Goa.html" title="Goa" />
<area shape="poly" alt="Kerala" coords="134,431,140,425,142,417,141,409,136,400,130,394,130,384,106,367,120,395,127,416" href="http://www.prokerala.com/kerala/population.htm" title="Kerala" target="_blank" />
<area shape="poly" alt="AP" coords="158,352,160,346,165,343,166,333,169,325,169,318,169,311,165,309,159,310,153,312,145,312,150,282,154,276,153,270,159,270,162,260,164,262,169,265,176,265,181,264,184,275,190,281,196,286,195,288,202,293,210,289,214,289,218,287,216,283,223,281,229,275,232,273,238,272,241,273,245,275,248,275,251,276,250,278,244,286,238,291,231,293,223,299,217,301,219,307,213,315,207,315,205,315,201,323,192,322,191,322,186,330,187,342,187,350,182,356,172,362,168,361,165,367,155,368,152,367,153,363,160,360" href="http://indiafacts.in/uncategorized/andhra-pradesh-districts-population-census-2011/" title="AP" />
<area shape="rect" alt = "india" coords = "0,0,443,473" href="http://updateox.com/india/district-wise-population-india-as-of-2011-census/" alt="" />
</map>


Then click on Extract Image Map from HTML.

7. Then fill the column name and value for the corresponding image area.


8.  Click OK, Test Prompts and save it.


Saturday, February 4, 2012

Save Column Properties


Save the Column Properties as "System wide deault for a column" or "System wide deault for data type".

When you build a request, you can edit properties for a column to control the appearance and layout
of a column and its contents. By default, your selections for a column apply only to the current
request.
If your user ID has the appropriate permissions, you can save your selections as the system-wide
default settings to use every time that data from the column, or columns of this particular data type,
appear in results.

Step1: Login to Presentation services as Administrator(By default Administrator has this permission).


Step2: Select any column from any table.


Step3: Click on column properties button of the column. Then you will get the column properties  window. Here you select all the properties.

Step4: Now click on the save button.


Now we can save the formatting properties as  the system-wide
default settings to use every time that data from the column, or columns of this particular data type,
appear in results.


Thursday, January 19, 2012

Maintenance Mode - OBIEE

Maintenance Mode is used for administration of Presentation Services. When Maintenance Mode is turned ON, users will not be able to save changes in Presentation Catalog- it goes in to a read-only mode at this point. This will make sure that webcat is consistent and no one is making changes to reports or saving new ones while you do your maintenance activities.  
To know more details  Click Here.

Saturday, December 3, 2011

% Acts as All Choices in OBIEE Prompts.

If we put % symbol in Default to ->Specific value box of a prompt, it will act as All choices.
Ex : In the below prompt, I have used % in   Default to ->Specific value box.


Now create a report.


Now add both prompt and report to dashboard and check.

Note : We have used % symbol in Specific value box and we get All Choices in dashboard as default value.

So, as we do not have All choices option in Default to drop down for Edit Box control, we can use the this strategy to set All choices.


Let's check in dashboard.


That is  by default our prompt is sending all values to filter of the report.

Wednesday, November 30, 2011

WEB CATALOG IN OBIEE 10G


WEB CATALOG IN OBIEE 10G
It is a good practice to start a new project in a new web catalog. Web Catalog is a just like a directory where we can place all our project related stuff(reports, filters, dashboards, prompts etc).
1.       To create a new web catalog, create a empty directory in the following directory path(where the OBI presentation Server is installed):
C:\OracleBIData\web\catalog 


2.       Now, edit the configuration file “instanceconfig.xml” to point to this new directory. instanceconfig.xml is located in the following directory path :


Now open and add your new directory name in catalog path.

3.Then restart the presentation server service. When the presentation server sees a empty directory , it    will create a necessary directory structure within it. 


3.       The Presentation Server creates the directory structure  as –
It creates a root directory under which creates three sub directories(shared, system, user) where each subdirectories are used for specific reasons.
User : The Presentation Server creates a subfolder for each user that registers in the web catalog in this folder.
 Shared : The shared folder is used to save and organize the dashboards, reports, prompts  ect .We can’t save any report, prompt or dashboard directly in this folder unless creating subfolder.

4.        To save these items we must create subfolder under  this shared folder.
How you structure sub-folders under the shared folder really a question of how the system will be used. We  might create one folder per dashboard, and place all the requests used by that dashboard within that folder, keeping things simple for when you want to apply security.
For example:  Sales Dashboard.
We can create a subfolder called Sales using Catalog Manager or directly in presentation services.
Creating  subfolder using catalog manager:
·         Open the Catalog Manager.
·         Go to file and select open catalog.
·         Provide the URL, user name and Password then click OK.
·         Then open the shared folder and create the subfolder Sales.


Creating  subfolder using Presentation Services :
While saving the requests or dashboard we can create subfolders under the share folder by clicking “Create Folder” button.  

Now we can save reports, prompts, dashboards related to Sales department in the Sales subfolder.
5.       If there are number of departments that are using  OBIEE,  then we can provide security for any department’s dashboards from other departments users by creating  web catalog “groups” and “web folder” .
The simple way to create these groups is to use the Add/Edit Group function with the web-based Presentation Services Administration screen.
In our case we have already created a web folder called “Sales”, now we will create a group called “Sales”.


6.       Now we   can set the permissions to the “Sales folder”  using Catalog Manager.  Open the Catalog Manager and right click on the Sales folder. Then click on Permissions.


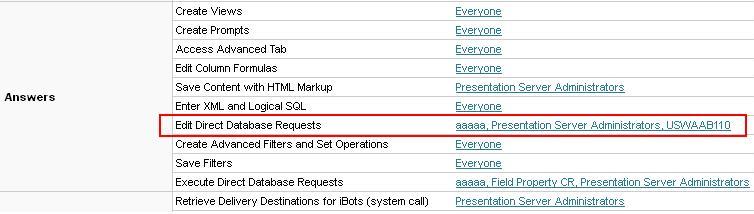
If you wish to allow only Sales group users to access the sales related dashboards then remove Everyone from and add Sales group to Users and groups(Explicit permissions) tab.
Now, only the sales group has permission to Sales folder, no other group has permission to this folder except Presentation Server Administrator.
 Like this we can create different group folders and group for different departments.
7.       The dashboards can be saved in group folders. That is if the dashboard is of Sales department then we can save it in Sales group folder or if the dashboard is related to Marketing department then we can save it in Marketing  group folder. 
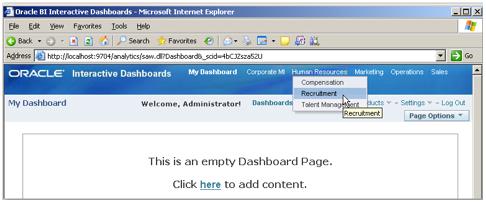


8.       Enable drop-down menus for dashboards within each catalog group:
Each department can then set up it’s own dashboards, requests, alerts and filters within its own shared, group folder (or indeed, create subfolders for specific areas of analysis). If departments end up creating lots of dashboards, the Presentation Server will automatically show them in a drop-down list with the group folder as the menu name once the number of visible dashboards for a user is fifteen or more. You can control this setting by adding a <DashboardMaxBeforeMenu> tag to the instanceconfig.xml file; I typically set it to 1 on real projects so that all departmental dashboards are shown in drop-down menus.


Tuesday, November 29, 2011

No Log Found

This is the usual message we get when we try to open the log file(ie, When we click on View Log in Session Management). This is due to the logging level the current user having.

The logging level is a parameter which control the level of information that you can retrieve in the log file.
 If we want the user to see log information in the log file, we should change the logging level in RPD.


Logging level = 0 means, no access to log file.

You can enable logging level for individual users, you cannot configure a logging level for a group.
In normal operations :
  • users have a logging level set to 0
  • administrator have a logging level set to 2
     
    Logging Levels Logging Level Information That Is Logged
    Level 0 No logging
    Level 1 Logs the SQL statement issued from the client application
    Logs elapsed times for query compilation, query execution, query cache processing, and back-end database processing
    Logs the query status (success, failure, termination, or timeout). Logs the user ID, session ID, and request ID for each query
    Level 2 Logs everything logged in Level 1
    Additionally, for each query, logs the repository name, business model name, presentation catalog (called Subject Area in Answers) name, SQL for the queries issued against physical databases, queries issued against the cache, number of rows returned from each query against a physical database and from queries issued against the cache, and the number of rows returned to the client application
    Level 3 Logs everything logged in Level 2
    Additionally, adds a log entry for the logical query plan, when a query that was supposed to seed the cache was not inserted into the cache, when existing cache entries are purged to make room for the current query, and when the attempt to update the exact match hit detector fails
    Level 4 Logs everything logged in Level 3
    Additionally, logs the query execution plan.
    Level 5 Logs everything logged in Level 4
    Additionally, logs intermediate row counts at various points in the execution plan.
     
    To change the logging level follow the below steps : 
    • In the Administration Tool, select Manage > Security . The Security Manager dialog box appears.
    • Double-click the user's user ID. The User dialog box appears.
    • Set the logging level by clicking the Up or Down arrows next to the Logging Level field.