Wednesday, December 7, 2011

Static Table in RPD.

If we have a requirement like we want a static table of data in OBIEE and we do not want to refer any data source, then we achieve this by creating View in RPD.
Oopen the New Physical Table window in RPD.

Give a name to the view, select "select" option from dropdown and write your query in the "defualt Initializing String" area.


Click on Column tab to add new column.           


Note - The column name in the select query and the column name which you have added in column tab must be same.

Now join this table with Fact table. 
In my case, I will create a alias table and make join.


Drag both the tables to BMM layer, and do the same join.Now drag the Static Table into presentation lay.


Restart the services and check the result in presentation services.


Saturday, December 3, 2011

% Acts as All Choices in OBIEE Prompts.

If we put % symbol in Default to ->Specific value box of a prompt, it will act as All choices.
Ex : In the below prompt, I have used % in   Default to ->Specific value box.


Now create a report.


Now add both prompt and report to dashboard and check.

Note : We have used % symbol in Specific value box and we get All Choices in dashboard as default value.

So, as we do not have All choices option in Default to drop down for Edit Box control, we can use the this strategy to set All choices.


Let's check in dashboard.


That is  by default our prompt is sending all values to filter of the report.

Wednesday, November 30, 2011

WEB CATALOG IN OBIEE 10G


WEB CATALOG IN OBIEE 10G
It is a good practice to start a new project in a new web catalog. Web Catalog is a just like a directory where we can place all our project related stuff(reports, filters, dashboards, prompts etc).
1.       To create a new web catalog, create a empty directory in the following directory path(where the OBI presentation Server is installed):
C:\OracleBIData\web\catalog 


2.       Now, edit the configuration file “instanceconfig.xml” to point to this new directory. instanceconfig.xml is located in the following directory path :


Now open and add your new directory name in catalog path.

3.Then restart the presentation server service. When the presentation server sees a empty directory , it    will create a necessary directory structure within it. 


3.       The Presentation Server creates the directory structure  as –
It creates a root directory under which creates three sub directories(shared, system, user) where each subdirectories are used for specific reasons.
User : The Presentation Server creates a subfolder for each user that registers in the web catalog in this folder.
 Shared : The shared folder is used to save and organize the dashboards, reports, prompts  ect .We can’t save any report, prompt or dashboard directly in this folder unless creating subfolder.

4.        To save these items we must create subfolder under  this shared folder.
How you structure sub-folders under the shared folder really a question of how the system will be used. We  might create one folder per dashboard, and place all the requests used by that dashboard within that folder, keeping things simple for when you want to apply security.
For example:  Sales Dashboard.
We can create a subfolder called Sales using Catalog Manager or directly in presentation services.
Creating  subfolder using catalog manager:
·         Open the Catalog Manager.
·         Go to file and select open catalog.
·         Provide the URL, user name and Password then click OK.
·         Then open the shared folder and create the subfolder Sales.


Creating  subfolder using Presentation Services :
While saving the requests or dashboard we can create subfolders under the share folder by clicking “Create Folder” button.  

Now we can save reports, prompts, dashboards related to Sales department in the Sales subfolder.
5.       If there are number of departments that are using  OBIEE,  then we can provide security for any department’s dashboards from other departments users by creating  web catalog “groups” and “web folder” .
The simple way to create these groups is to use the Add/Edit Group function with the web-based Presentation Services Administration screen.
In our case we have already created a web folder called “Sales”, now we will create a group called “Sales”.


6.       Now we   can set the permissions to the “Sales folder”  using Catalog Manager.  Open the Catalog Manager and right click on the Sales folder. Then click on Permissions.


If you wish to allow only Sales group users to access the sales related dashboards then remove Everyone from and add Sales group to Users and groups(Explicit permissions) tab.
Now, only the sales group has permission to Sales folder, no other group has permission to this folder except Presentation Server Administrator.
 Like this we can create different group folders and group for different departments.
7.       The dashboards can be saved in group folders. That is if the dashboard is of Sales department then we can save it in Sales group folder or if the dashboard is related to Marketing department then we can save it in Marketing  group folder. 


8.       Enable drop-down menus for dashboards within each catalog group:
Each department can then set up it’s own dashboards, requests, alerts and filters within its own shared, group folder (or indeed, create subfolders for specific areas of analysis). If departments end up creating lots of dashboards, the Presentation Server will automatically show them in a drop-down list with the group folder as the menu name once the number of visible dashboards for a user is fifteen or more. You can control this setting by adding a <DashboardMaxBeforeMenu> tag to the instanceconfig.xml file; I typically set it to 1 on real projects so that all departmental dashboards are shown in drop-down menus.


Tuesday, November 29, 2011

No Log Found

This is the usual message we get when we try to open the log file(ie, When we click on View Log in Session Management). This is due to the logging level the current user having.

The logging level is a parameter which control the level of information that you can retrieve in the log file.
 If we want the user to see log information in the log file, we should change the logging level in RPD.


Logging level = 0 means, no access to log file.

You can enable logging level for individual users, you cannot configure a logging level for a group.
In normal operations :
  • users have a logging level set to 0
  • administrator have a logging level set to 2
     
    Logging Levels Logging Level Information That Is Logged
    Level 0 No logging
    Level 1 Logs the SQL statement issued from the client application
    Logs elapsed times for query compilation, query execution, query cache processing, and back-end database processing
    Logs the query status (success, failure, termination, or timeout). Logs the user ID, session ID, and request ID for each query
    Level 2 Logs everything logged in Level 1
    Additionally, for each query, logs the repository name, business model name, presentation catalog (called Subject Area in Answers) name, SQL for the queries issued against physical databases, queries issued against the cache, number of rows returned from each query against a physical database and from queries issued against the cache, and the number of rows returned to the client application
    Level 3 Logs everything logged in Level 2
    Additionally, adds a log entry for the logical query plan, when a query that was supposed to seed the cache was not inserted into the cache, when existing cache entries are purged to make room for the current query, and when the attempt to update the exact match hit detector fails
    Level 4 Logs everything logged in Level 3
    Additionally, logs the query execution plan.
    Level 5 Logs everything logged in Level 4
    Additionally, logs intermediate row counts at various points in the execution plan.
     
    To change the logging level follow the below steps : 
    • In the Administration Tool, select Manage > Security . The Security Manager dialog box appears.
    • Double-click the user's user ID. The User dialog box appears.
    • Set the logging level by clicking the Up or Down arrows next to the Logging Level field.


Display Dashboards in DropDown Menu

The  OBI Presentation services in default  displays dashboards as links when there are less than or equal to 15 dashboard names.


Observe the above image, there are 15 dashboards and displaying as separate links.

When more than 15 dashboard names are available for display, the default behavior of Oracle
Dashboards is to create a drop-down list of the dashboards from which users can choose.Now if we create one more dashboard, then a drop-down list will be created.


By modifying the instanceconfig.xml file, you can change the number of dashboard names to display
as links before the presentation is changed to a drop-down list.

Add/Modify the following entry in the instanceconfig.xml file. The minimum value is 1.
<DashboardMaxBeforeMenu>1</DashboardMaxBeforeMenu>

The above line makes the presentation server to create a dropdown list when there are more than one dashboard.

Tuesday, October 11, 2011

Reset the Adminisrator Tool Password in OBIEE

Step1 : Open NQSConfig.INI file (Path : C:\OracleBI\server\Config\NQSConfig.INI)
Step2 : Go to Security part and find AUTHENTICATION_TYPE = BYPASS_NQS;
            Uncomment (remove #) this part.
Step3 : Stop the BI Server service
Step4 : Close Administration Tool, if opened. (Then only the changes are affecting to the Administration Tool)
Step5 : Open Administration Tool, then rpd which needs password reset, in offline mode.
Step5 : Give any password, it accepts.
Step6 : Now go to Manage > Security. From here it’s the normal process how you change password.
Step7 : Save the changes to rpd.
Step8 : Revert back the changes in NQSConfig.INI
Step9 : Start BI Server and open rpd with new password.


Saturday, August 6, 2011

Save Column Properties


Save the Column Properties as "System wide deault for a column" or "System wide deault for data type".

When you build a request, you can edit properties for a column to control the appearance and layout
of a column and its contents. By default, your selections for a column apply only to the current
request.
If your user ID has the appropriate permissions, you can save your selections as the system-wide
default settings to use every time that data from the column, or columns of this particular data type,
appear in results.

Step1: Login to Presentation services as Administrator(By default Administrator has this permission).


Step2: Select any column from any table.


Step3: Click on column properties button of the column. Then you will get the column properties  window. Here you select all the properties.

Step4: Now click on the save button.

Notice that two options are displaying.


If you select "as the system-wide default for <column name>"(in our case column name is "E05  Manager Name"), these format properties will be default for system wide for this column. That is these properties will be default for this column when you login as any user.

If you select "as the system-wide default for this data type", these format properties will be default for system wide for the this data type(In our case, String is the data type of this, so this property will be applied to all the columns having String as data type ). That is these properties will be default for this column when you login as any user.
Step5: select the first option ie"as the system-wide default for  "E05  Manager Name", then click OK.Now click on Results tab.


Step6: Now click on Criteria tab and add the same column("D5 Employee"."E05  Manager Name") and one different column(in my case, "D5 Employee"."E03  Supervisor Name") and don't do any column  format changes.


Step7: Even If we login as diffenrent user, the same column format properties will be the default.
Now login as defferent user and select the above columns and display the result. Click on the Result tab.


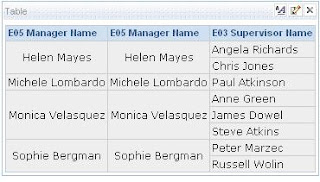
Observe that the second column having the same column format properties as of first colomn but the third column having the different column properties. This is because of, the first and second column are same columns so the second column acquired the same format properties  of first column as the default format column properties.

If we select the second option ("as the system-wide default for this data type") then the format properties will reflect to all String type columns.

Select the second option and then click OK.


Now login as defferent user and select the String type column and display the result. We will get the same column format properties as the default properties.


Then click on the Result tab.


Observe that the third column also having the same column format properties even if we dint set the propertied explicitly for that column.


Friday, August 5, 2011

Using a Saved Oracle BI Request as a Filter


Any saved request that returns a column of values can be used to filter the selected column in your request.

Step1 : create a request with column(s) that will be used as a filter for any column of new request.


save the request.(In my case path : users/jaga/req_filter)

Step2 : Let us create a new request where we want to use previous request as filter for columns.
Add any column to the request, then click on the filter button.


Step3 : Next, click on then Advanced button and select "Filter based on results of another request" option.


Step4 : From the Relationship dropdown select the operator, then type/browse the path of the saved request which you want to use a filter for this column.


Step4 : Now we can select the any column of saved request (to be used as filter) using the "Use values in Column" dropdown.


If the saved request contains a matching column name, it appears in the Use Values in Column
drop-down list. If you want to use another column, select it instead.
Then Click OK . Now you can notice that the filter have been added to the request.


Now click on the "Results" tab to see results.
Comparison of result of new request and saved request.
Result of saved reuest :


Result of New Request :


We can see that the "E05 Manager Name" column is filtered by the "E05 Manager Name" column of saved request.